← Home

UChicago Pathways in Data Science · July 2026

Started at UChicago.
Continued at home.

Automobile Efficiency Across Eras began as my team’s final project in a three-week summer program. After I returned home, I kept the original question and built outward: more decades, more careful tests, more transparent data notes, and a public site where readers can examine the work directly.

Explore the analysis View the GitHub repository
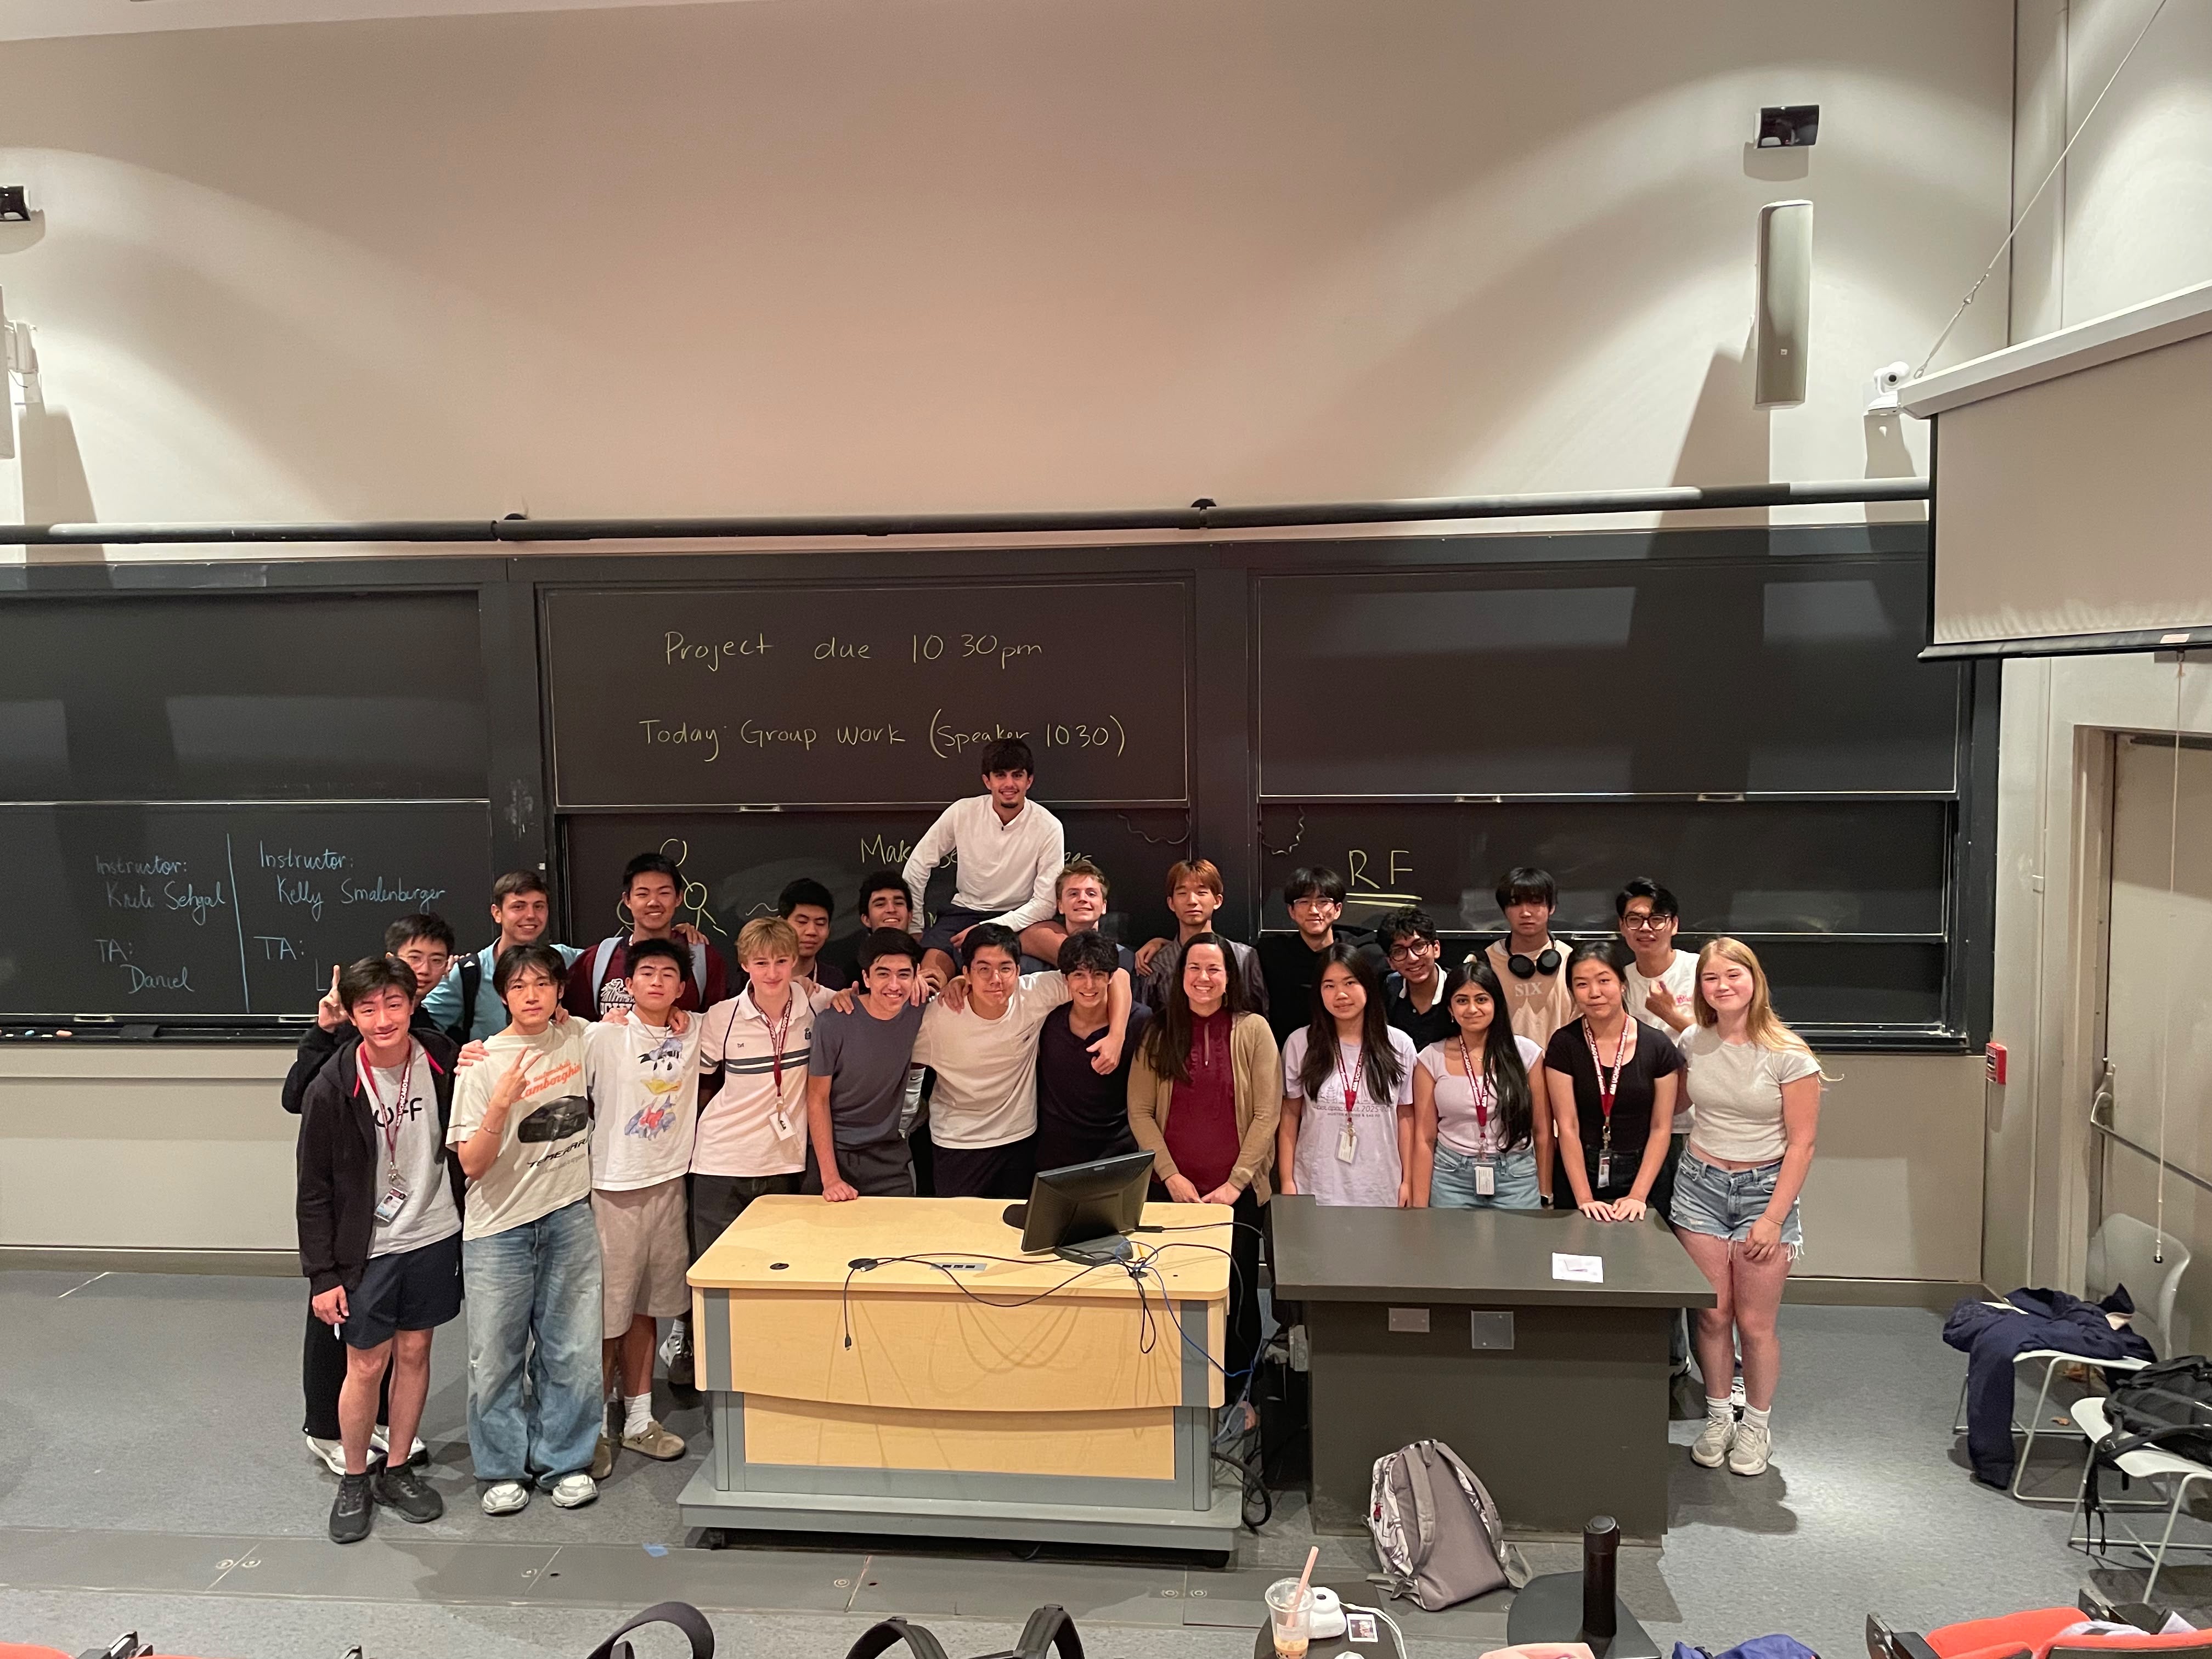
Keshu Yang and the University of Chicago Pathways in Data Science class gathered in a lecture hall.
Where it started Pathways in Data Science class · University of Chicago · July 2026

01 · The handoff

The program ended.
The question did not.

The most important part of the project was not the final presentation. It was realizing how many good questions remained after it.

01

At UChicago

Build the first model together.

I coordinated data cleaning, model comparison, interpretation, and presentation for a four-member team's study of nearly 400 historical automobiles. We used k-nearest neighbors and multiple linear regression to predict miles per gallon.

Starting data
1970–1982 Auto MPG
Team output
Models + final presentation
02

Back at home

Test whether the answer survives time.

I kept the historical analysis, added 1999–2008 vehicle data and EPA trends through 2024, separated sources with different testing rules, and built new studies of long-run trends, chronological prediction, cross-era model drift, and model-adjusted residuals.

Expanded scope
1970–2026
Independent output
Pipeline + notebooks + report + website

02 · What grew

From one prediction task to a study across eras.

I did not force every source into one oversized table. Each dataset has a specific role, and the project keeps those boundaries visible.

One dataset → overlapping sources

Use each dataset for the question it can actually answer.

The original UCI file supports historical model comparison. EPA annual data supplies long-run, production-weighted context. Later vehicle files make chronological and cross-era tests possible.

One split → stronger tests

Ask what happens outside a convenient random sample.

The expanded analysis compares ordinary train/test results with later-year holdouts, held-out model families, and transfer tests between vehicle periods. Accuracy declined on newer cars, showing how SUV and pickup growth limited overall efficiency gains.

One presentation → a research system

Make the reasoning reproducible and inspectable.

Six notebooks, a repeatable data pipeline, a written report, source documentation, and a route-verified static site now carry the work beyond the original classroom presentation.

One result in context: EPA real-world fuel economy rose from 13.1 MPG in 1975 to 27.2 MPG in 2024. The later-year tests also showed why that overall improvement does not mean a model trained on older vehicles will transfer cleanly to newer ones.

What I carried home

A finished class project answers the prompt. An independent project keeps asking what the first answer left out.

Read the repository More about me →